
CleanerHQ · For cleaning businesses
See which cleaning jobs made money.
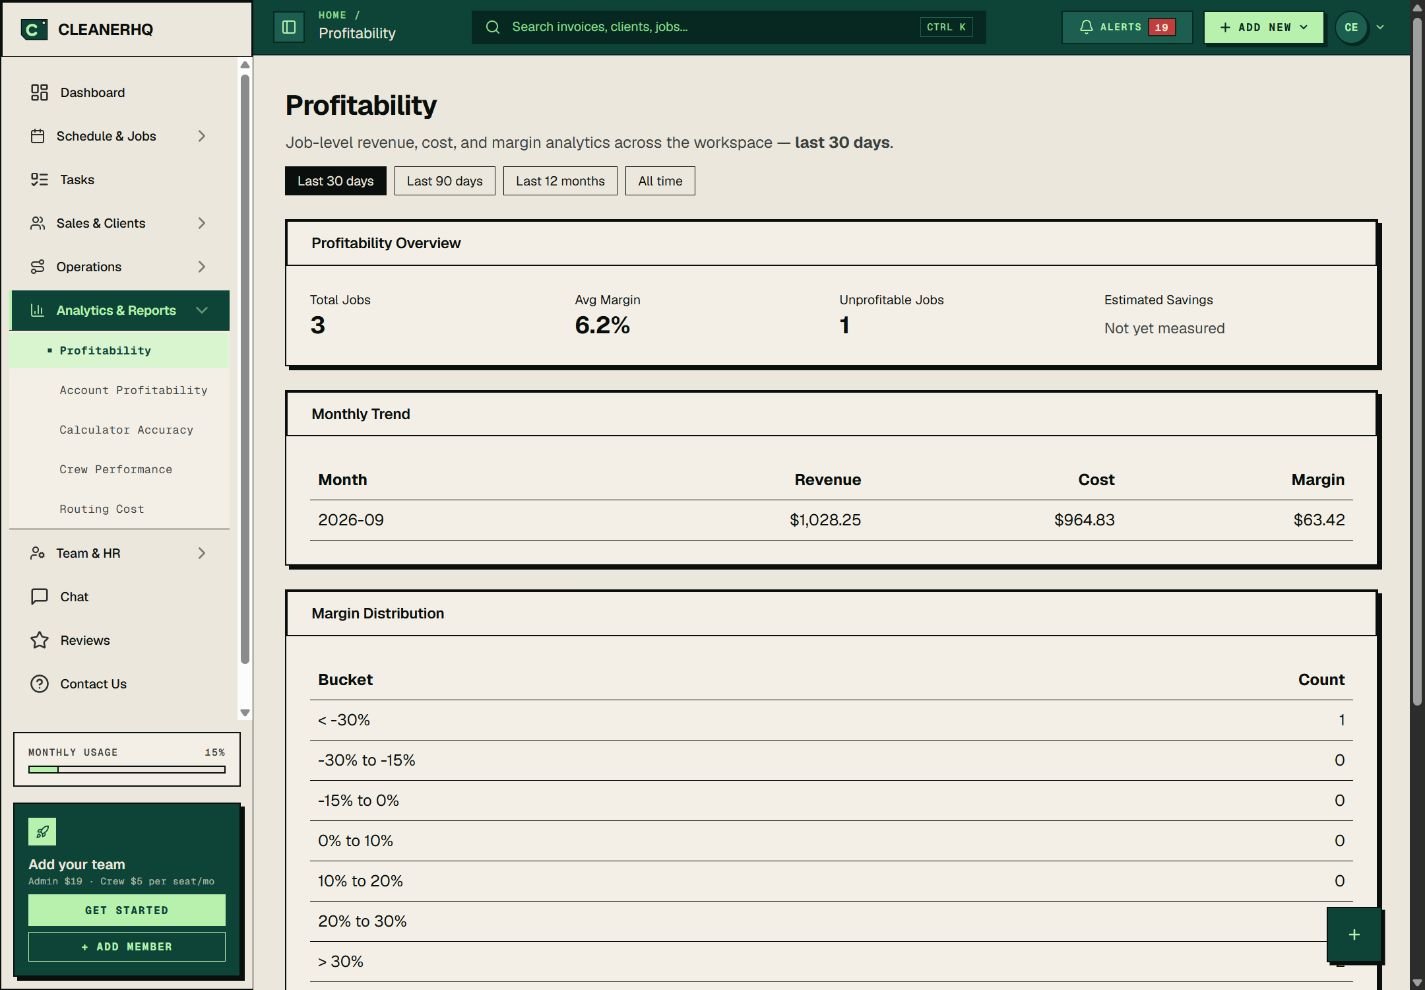
CleanerHQ’s cleaning job profit reports bring job income and costs into one view. Find a job that lost money, open its record, and check what drove the loss.
- Compare income and costs
- Find jobs that lost money
- Review the job details
CleanerHQ launches November 8, 2026. See prices and trial terms.
See it in CleanerHQ
Start with cleaning job profit
A full calendar does not tell you what is left after costs. The report shows income, costs, and profit for the jobs in view.
The dashboard also links to jobs that lost money. Use that list to choose which job to review first.
Open the job behind the number
A low result needs a closer look. Check the work done, crew time, supplies, and any extra cost in the job record.
Was the price too low? Did the job take longer than planned? Use the record to work out what happened before you change the next quote.
Know what the figures can tell you
A report depends on the data recorded. Missing time or costs can make a job look better than it was.
Check the date range and the jobs included. Job profit is not the same as the cash in your bank or your full company accounts.
Use the lesson on the next quote
Compare the actual job with your first estimate. If the work took longer, allow more time when you price a similar job.
Use the job cost calculator before you quote. Then check the result here after the work.
Questions about this feature
Is this a report on completed work?
Yes. The screenshot shows a report on recorded jobs. Use the job cost calculator when you need to check an estimate before the work starts.
Are the figures in the screenshot real customer results?
No. They are demo records in the actual app. They do not show savings or profit earned by a customer.
See the related steps
- Cleaning Supply Tracking and Stock Checks →
- Automatic Clock-Out Review for Cleaners →
- Cleaning Business Scheduling Software →
- Plan a Cleaning Referral Program →
See how the steps fit together in CleanerHQ’s cleaning business software.
Bring one job to a demo