Running a successful cleaning business takes more than just shiny floors and happy clients. If you’re managing a cleaning crew, tracking the right performance metrics can really turn things around.
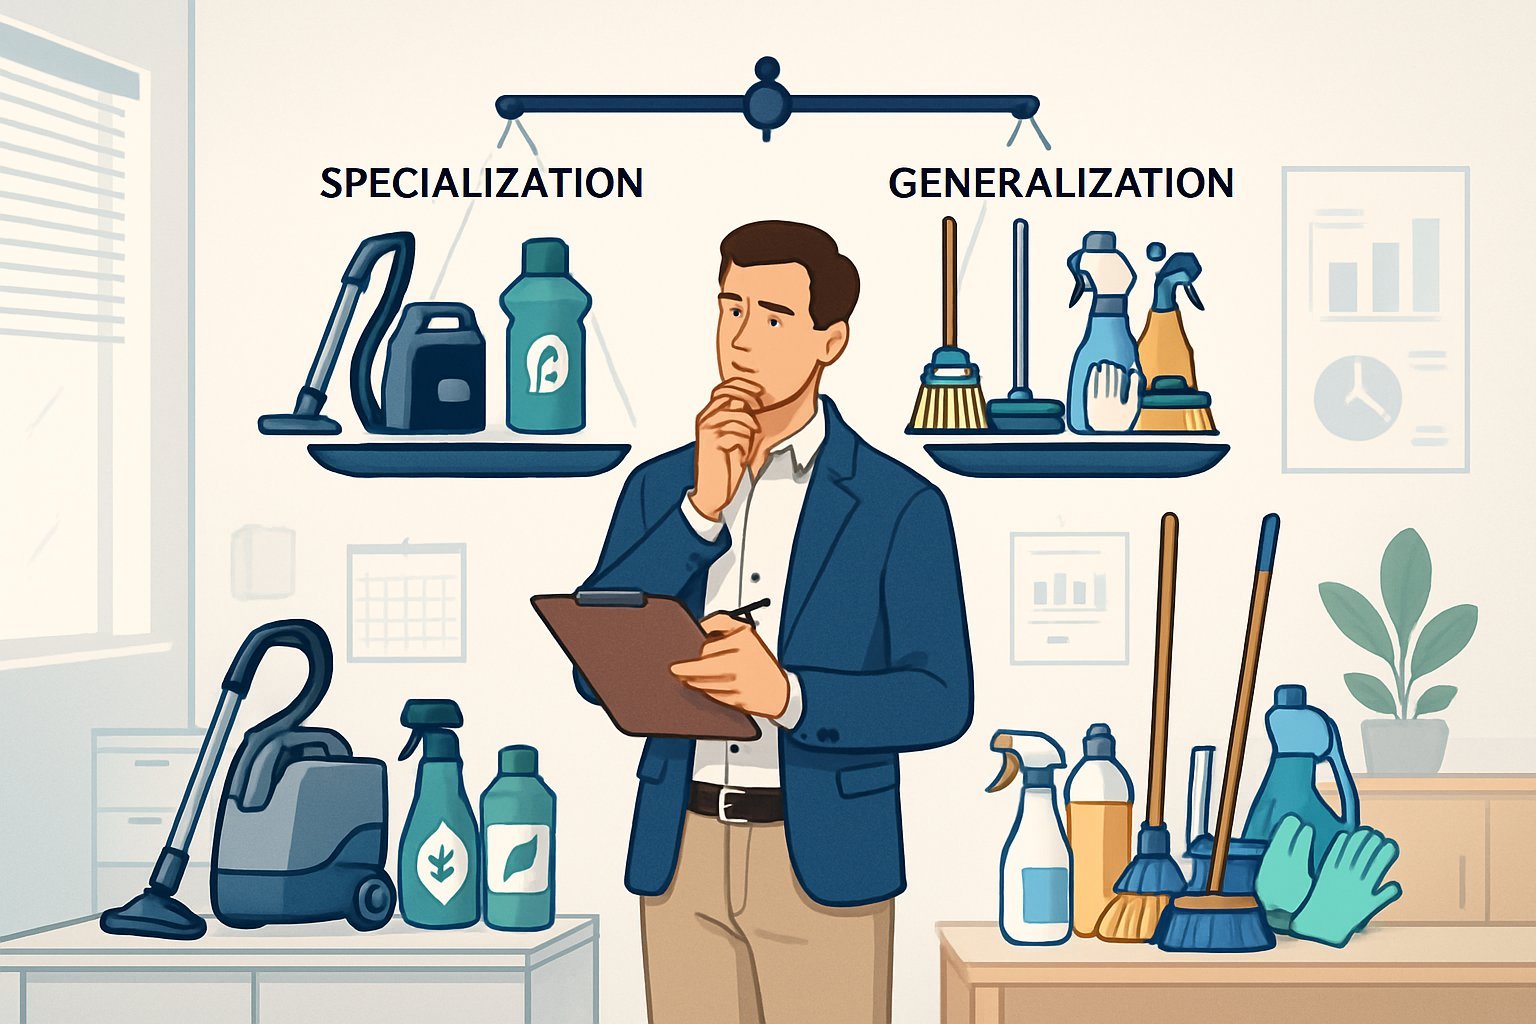
The five essential KPIs every cleaning operation should monitor are jobs completed per day, customer satisfaction scores, quality audit results, revenue per cleaner, and turnover rate.
These metrics tell a story about your team’s performance that goes way beyond what you see on the surface. If you track jobs completed per day, you’ll catch productivity trends before they snowball.
Customer satisfaction scores let you know if you’re hitting your quality standards consistently. Quality audit results give you hard data about how well your team delivers.
It’s all about using this info to make decisions—without hovering over every move your team makes. If you keep your eyes on outcomes instead of micromanaging, you’ll give your team space to improve.
Revenue per cleaner and turnover rates show which strategies actually help your business and your employees.
Key Takeaways
- Track five core metrics to measure cleaning team performance and spot areas for improvement.
- Use data to guide team decisions and avoid micromanagement that drags down morale.
- Focus on outcome-based measurements that actually connect team performance to business results.
Why Performance Metrics Matter for Cleaning Teams
Performance metrics give cleaning managers real data to make better choices and run smoother operations. They highlight what’s working, flag problems early, and show the true value of your cleaning crew.
Impact on Client Satisfaction and Retention
Client satisfaction ties directly to how well your cleaning team handles their daily jobs. If you monitor customer satisfaction scores, you can catch issues before clients get annoyed or bail.
Quality audit results pinpoint where teams shine and where they need help. If your team scores 95% on audits, chances are your clients are happier than if you’re stuck at 80%.
Customer retention rates tell the rest of the story. Teams that nail their performance metrics usually keep 85-90% of their clients each year. Teams that lag behind can see retention drop to 60-70%.
Regular feedback from clients helps teams figure out what really matters. Some clients just want things done fast, while others obsess over details.
Tracking how quickly you respond to client requests is important too. Teams that jump on issues within 4 hours almost always have higher satisfaction scores than those who drag their feet for a day or more.
Aligning Team Goals with Business Objectives
Performance metrics help cleaning managers tie day-to-day work to the bigger business picture. When teams know their targets, they work more efficiently toward shared goals.
Jobs completed per day shows if your team is hitting productivity targets. If a team only finishes 8 jobs when the goal is 10, it’s time for support or training.
Revenue per cleaner tells you which team members drive business growth. Top performers can bring in 20-30% more revenue than average workers.
Clear KPIs create accountability without breathing down everyone’s neck. Team members can check their own progress and tweak their habits.
Metrics help with resource planning too. You can predict staffing needs based on past performance and what’s coming up.
Gaining a Competitive Edge through Data
Teams that lean on data tend to outpace those who just go with their gut. When managers use metrics to steer decisions, things run smoother.
If you track turnover rates, you’ll spend less on hiring and keep your service more consistent. High turnover usually means something’s off with training, pay, or working conditions.
Performance benchmarking lets you see how your team stacks up to industry standards. If your team cleans 1,200 square feet per hour but the standard is 1,500, there’s room to get faster.
Smart scheduling, based on real numbers, cuts travel time and bumps up daily productivity. You can finish more jobs in less time.
Quality consistency gives you an edge when bidding for contracts. Clients are willing to pay more for reliable, data-backed service.
Demonstrating Value to Stakeholders
Performance metrics give you proof—real numbers—to show building owners, facility managers, and other stakeholders the value of your team. Numbers just hit harder than promises.
Cost per square foot cleaned shows how financially efficient you are. Stakeholders can compare this to other vendors or in-house teams.
Before-and-after quality scores highlight improvement. If your team climbs from 75% to 90% on audits, that’s progress you can show off.
Tracking safety incidents protects both workers and clients. If your team goes 12 months without an accident, that’s a big deal.
Combine client testimonials with satisfaction scores for contract renewals. Hard data backs up glowing feedback from happy customers.
Environmental compliance matters more and more. Tracking green cleaning practices and waste reduction shows you care about sustainability.
Essential KPIs to Track for Cleaning Team Management
Tracking the right performance metrics helps managers actually see how well their cleaning teams are doing. These key performance indicators spotlight strengths and areas that need work.
Jobs Completed Per Day
Jobs completed per day tells you how many tasks each cleaner finishes in a shift. It’s a solid way to measure productivity.
You just count up the finished jobs and compare that to the schedule. A typical office cleaner might knock out 8-12 rooms a day, depending on size and what’s needed.
What affects completion rates:
- Room size and layout
- Type of cleaning required
- Equipment on hand
- How experienced your staff is
This info helps managers catch productivity dips early. If someone who usually finishes 10 jobs drops to 6, maybe they need extra training or better gear.
Task completion rates also help with scheduling. You can match the workload to each person’s usual output.
Customer Satisfaction Scores
Customer satisfaction scores show how happy clients are with your cleaning. You get these from surveys, feedback forms, or just chatting with clients.
Most companies go with a 1-10 scale or something simple. Scores above 8? That’s usually a win.
Ways to collect satisfaction data:
- Monthly client surveys
- Watching online reviews
- Direct feedback calls
- Quick chats during site visits
Low scores flag specific issues. Maybe someone keeps missing the trash or leaves a restroom dirty. This feedback helps you fix things fast.
High scores highlight your stars. Managers can use these top performers as examples.
Quality Audit and Inspection Results
Quality audits check if cleaning meets company standards. Managers or supervisors do walk-throughs with checklists.
Inspection results usually come as percentage scores. If you get 95%, that means 95% of tasks were done right.
Audit areas include:
- How well surfaces are cleaned
- If trash is removed
- Supplies restocked
- Equipment maintained
Regular audits catch problems before clients even notice. If someone’s only hitting 70% on restrooms, they need a refresher.
These results also show where the team as a whole needs training. If everyone’s struggling with floors, maybe it’s time for new tools.
Revenue Per Cleaner
Revenue per cleaner tells you how much money each team member brings in. It’s a key way to see individual value and overall profitability.
Divide total client payments by the number of cleaners on those accounts. If someone covers $2,000 worth of contracts each month, that’s their revenue.
What bumps up revenue per cleaner:
- Bigger, higher-paying accounts
- Getting work done efficiently
- Selling add-on services
- Cutting down on wasted materials
These numbers help with pay decisions and promotions. If a cleaner brings in more, maybe they deserve a raise or better gigs.
Managers can also use this data to spread high-revenue accounts more fairly.
Measuring and Improving Team Productivity
Cleaning team productivity really depends on three things: tracking each employee’s output, keeping an eye on schedule adherence and task completion, and holding onto your people with good retention strategies.
Employee Productivity Metrics
Start by measuring jobs completed per day and revenue per cleaner. Managers should check these numbers weekly to spot trends and gaps.
Key productivity metrics:
- Tasks done per hour
- Square footage cleaned per shift
- Revenue per employee
- Time spent per cleaning type
Top teams finish 78% or more of scheduled tasks each day. If you’re below that, it’s time to review your workflow or add training.
Productivity rates help you see who’s excelling and who needs support. Use this info to balance workloads and prevent burnout.
Track how much time team members spend actually cleaning versus waiting around. The sweet spot is about 70-80% utilization.
Schedule Adherence and Task Completion
Schedule adherence checks how well teams stick to planned routes and timing. If they miss the mark, you’ll hear it from clients.
Track task completion rates by:
- Jobs finished on scheduled days
- Tasks done within time windows
- Route efficiency
- Sticking to client appointments
Strong teams hit 85% or higher on-time rates. If you’re under that, maybe you need more staff or better scheduling.
Use time tracking tools to compare actual task duration to estimates. This helps you build realistic schedules.
If teams keep missing schedules, look at workload and training. Sometimes it’s just poor route planning.
Monitoring Turnover and Absenteeism
Employee turnover costs cleaning companies a ton—anywhere from $3,000 to $5,000 for each person who leaves. High turnover (over 30% a year) wrecks productivity and customer service.
Track these monthly:
- Turnover rate by team and location
- Days between hire and quitting
- Absenteeism patterns
- Feedback from exit interviews
You can boost retention by tackling the usual causes: bad training, unfair schedules, no room to grow.
Watch absenteeism by tracking unplanned absences for each worker. If it’s over 8% a year, something’s probably wrong.
Use this info to spot employees who might leave. Regular check-ins and better perks can help keep good people around.
Quality Control and Service Delivery Metrics
Solid quality control comes down to clear standards and good documentation. Regular audits and photo evidence let you track performance and build client trust.
Setting and Auditing Cleaning Standards
Cleaning standards set the baseline for quality control. They need to be specific and measurable—not just vague goals.
Clear Quality Standards:
- Specific tasks for each room type
- Time limits for each job
- What “clean” actually looks like
- Required cleaning products and methods
Audit jobs regularly using checklists. Managers can score each area from 1-5 or just mark pass/fail. How often you audit depends on client needs.
Most companies check 10-20% of jobs weekly. New clients or trouble spots need more frequent checks. High-performing teams? Maybe less.
Key Audit Areas:
- Restrooms and fixtures
- Floor cleaning and upkeep
- Trash removal
- Dusting and sanitizing
- Entryways and glass
Let teams know audit schedules and criteria. This helps them hit targets without feeling watched every second.
Photo Documentation and Inspection Tools
Photo documentation turns quality control into something real—not just opinions. Before-and-after photos prove the job got done and help settle client disputes.
Digital inspection tools make this way easier. Mobile apps let cleaners upload photos straight to client portals. That builds trust and proves your team’s on the ball.
What to photograph:
- Problem spots before cleaning
- Results after cleaning
- Any damage or equipment issues
- Supply shortages or repairs needed
Time stamps and location info add credibility. Many apps handle this automatically. Focus photos on specifics, not just wide shots.
Visual evidence makes inspections more accurate. Managers can look at photos remotely instead of running all over town.
Some companies use photos for training. New hires can see what “good” looks like. Documenting problem areas helps with future fixes.
Customer Satisfaction and Retention KPIs
Keeping tabs on client satisfaction scores and customer retention rates gives cleaning managers a real sense of service quality and long-term business health. Fast responses to client requests also go a long way toward keeping customers loyal.
Collecting and Analyzing Customer Feedback
Customer feedback gives you a front-row seat to service quality and what needs fixing. Cleaning managers should use several feedback channels to really understand what’s going on.
Digital surveys make it easy to gather feedback fast. A quick text or email with a simple rating scale right after a service visit can capture how clients feel. Keep these surveys short—three to five questions usually does the trick.
Phone calls once a month let managers dig deeper than surveys. You get to ask about specific cleaners and service quality, and clients tend to open up more during a call.
Online reviews on Google, Yelp, and similar sites show you what the public thinks. Check these weekly and reply to both good and bad reviews as soon as possible.
Track feedback with these metrics:
- Average satisfaction score (shoot for 4.5+ out of 5)
- Survey response rate (aim for 25-30%)
- Complaint resolution time (try for within 24 hours)
Look at trends every month to catch issues early. If scores dip for certain cleaners or locations, dig in right away.
Customer Retention Rate
Customer retention rate tells you how many clients stick around over time. High retention means happy customers and steady income.
To calculate retention rate: Retention Rate = (Customers at End – New Customers) ÷ Customers at Start × 100
Most cleaning companies should aim for 85-95% annual retention. Monthly retention should stay above 95%.
Track retention by service type, cleaner, and client size. Commercial clients usually stick around longer than residential ones.
What affects retention?
- Consistent service quality
- Assigning the same cleaner each visit when you can
- Fast response to complaints
- Competitive pricing
Check retention every month. If it drops below your target, find out why. Exit interviews with clients who leave can show you what to fix.
Response Time to Client Inquiries
How fast you reply to clients really matters for satisfaction and retention. Quick responses show that you care and take things seriously.
Set these response goals:
- Emergencies: within 2 hours
- General questions: same business day
- Scheduling: within 4 hours
- Complaints: within 1 hour
Track response times with customer service software or a simple spreadsheet. Start the clock when the client reaches out, and stop it when you give a full answer.
Train your office staff and managers on how to reply. Use templates for common questions to speed things up but don’t let quality drop.
Watch these metrics each week:
- Average response time by inquiry type
- Percentage of responses meeting your time goals
- Client satisfaction with response speed
Clients often care more about a fast reply than a perfect answer right away. Even just acknowledging the message within 30 minutes can make a difference.
Leveraging Data and Digital Tools Without Micromanaging
Smart tech helps cleaning managers keep tabs on team performance without breathing down everyone’s neck. The right digital tools gather data automatically and give you clear insights—no need to hover.
Choosing the Right Janitorial Software
Modern janitorial software is the backbone of data-driven management. These platforms track job times, client feedback, and supply usage across all your locations.
Look for these features:
- Real-time job tracking and scheduling
- Customer feedback collection
- Inventory management integration
- Mobile app compatibility
- Automated reporting dashboards
Popular choices like CleanTelligent, ServiceTitan, and Swept each have their strengths. CleanTelligent is great for quality checks, ServiceTitan nails complex scheduling, and Swept is all about route optimization.
The best software connects everyone on one system. Cleaners see their daily tasks, supervisors check progress, and managers review trends. It’s transparent but not intrusive.
Automated Data Collection and Mobile Access
Automated systems take manual data entry out of the equation. Mobile apps let cleaners check schedules, report issues, and do quality checks right from their phones.
Key automated features:
- GPS tracking for arrivals and departures
- Photo uploads for before-and-after proof
- Digital checklists that sync automatically
- Client feedback forms sent out on their own
Mobile access gives cleaning staff more control over their work. They know what needs doing without waiting for instructions. That kind of independence builds accountability and cuts down on micromanaging.
Janitorial managers see real-time updates without constant check-ins. If something goes wrong, the system pings the right people. Tech keeps things moving—no need for heavy-handed oversight.
Using Performance Analytics for Continuous Improvement
Performance analytics turn raw numbers into real insights for your team. Instead of guessing, managers use actual data to guide decisions and coaching.
Key analytics to track:
- Job completion rates by cleaner and location
- Time spent per task vs. industry benchmarks
- Customer satisfaction trends
- Supply costs per square foot cleaned
These numbers show you where to tweak operations. If a cleaner always finishes early, maybe they can take on more. Low satisfaction at one site? Time for some extra training.
Use data to support, not punish. When cleaners see their own progress, they usually fix issues themselves. Regular data reviews can feel like coaching, not judging.
Analytics also reveal bigger problems before clients notice. Equipment failures, supply shortages, or scheduling issues pop up in the data first.
Linking Financial Outcomes to Team Performance
Smart cleaning business owners track financial numbers alongside operations data. Labor costs, supply expenses, and revenue all show how well you’re balancing efficiency and service.
Labor Costs Versus Profit Margins
Labor usually eats up 60-70% of cleaning costs. Managers need to track hours worked per job and revenue per hour to keep profit margins healthy.
Track labor cost per square foot cleaned and revenue per labor hour. For example, if a cleaner makes $15/hour and brings in $60 worth of work, that’s a 25% labor cost ratio.
How to track labor:
- Daily labor hours vs. jobs finished
- Overtime hours as a percent of total
- Labor cost per client location
- Revenue per cleaner per day
Teams with higher productivity often deliver better margins. If cleaners finish faster without cutting corners, labor costs drop while revenue stays up.
Compare cleaners to spot who needs more training. If someone takes 20% longer than the rest, maybe they need better skills or equipment.
Supply Usage and Cost Control
Supply costs can eat into profits when teams waste materials or use pricier products carelessly. Tracking supplies per job tells you which teams keep costs in check.
Watch chemical usage per square foot and how often you replace equipment. If a team uses 15% more supplies than average, profits take a hit.
Track these supply metrics:
- Chemical cost per job type
- Equipment maintenance frequency
- Paper product usage per location
- Cleaning tool replacement rates
Teams with good training use supplies more efficiently. Cleaners who measure chemicals right and maintain gear keep supply costs at 8-12% of revenue.
Compare usage across teams and locations. High-performing crews often have tricks that others can learn to cut waste.
Revenue Growth and Profitability
Revenue per cleaner shows who’s helping your business grow. Top performers can bring in 25-40% more than the average team member.
Track monthly revenue per cleaner and client retention rates by team. Teams with better customer satisfaction usually have steadier revenue.
Track revenue with:
- Monthly revenue per team member
- New client signups by team
- Service upsells
- Client contract renewals
Teams that keep quality high lose fewer clients. Every client you keep saves you $200-500 in acquisition costs.
Watch which teams sell add-on services like deep cleaning. These extras boost profits way beyond standard contracts.
High-performing teams often justify charging more. Clients will pay 10-20% extra for reliable, top-notch work.
Best Practices for Data-Driven Management in Cleaning Operations
Data-driven management only works if you communicate metrics clearly and use insights to create targeted training. Consistency and trust matter as much as the numbers.
Building Employee Engagement through Transparent KPIs
Sharing performance metrics with your teams builds accountability—without turning work into a numbers game. Managers should post weekly dashboards showing things like square footage cleaned per hour and satisfaction scores for each cleaner.
Recognition works best when tied to specific data:
- Top performer awards for productivity
- Bonuses for high quality scores
- Team celebrations for hitting customer satisfaction goals
Regular feedback sessions help employees understand their numbers. Meet with each cleaner monthly to review their stats and talk improvement.
Transparency builds trust. When employees see how their work connects to business success, engagement jumps by 15-20%.
Implementing Effective Training Programs
Training should target gaps you find in the data. Use audit results and productivity numbers to create focused skill sessions for individuals or teams.
Common training needs:
- Low ATP scores mean disinfection technique needs work
- Long cleaning times suggest equipment or method issues
- Bad customer ratings point to communication or quality gaps
Start new employees with KPI expectations from day one. Give them clear targets—like 1,500 square feet per hour and a minimum satisfaction score of 9 out of 10.
Schedule follow-up training based on the numbers. Teams with slipping performance need a refresher, while top performers might want advanced workshops.
Maintaining High Cleaning Standards Over Time
Consistency comes from checking cleaning standards through several data sources. Combine ATP testing, customer feedback, and visual audits to track trends.
Weekly quality checks help keep standards up:
- Random ATP swabs on high-touch spots
- Supervisor audits with standard checklists
- Customer satisfaction surveys at set intervals
Performance software shows when standards dip before it becomes a crisis. Real-time dashboards flag locations or teams falling below the bar.
Keep an eye on supply costs too. Sudden spikes in chemicals or supplies can mean teams are overcompensating for sloppy technique.
Frequently Asked Questions
Managing cleaning team performance means using clear metrics and real strategies. Here are answers to common questions about tracking efficiency, boosting satisfaction, and cutting turnover.
What are the critical KPIs for evaluating the efficiency of a cleaning team?
The big ones: jobs completed per day, time spent on site, and task completion rates. Most teams hit five to seven jobs per shift.
Attendance and punctuality show reliability. Quality inspection scores measure standards each month.
Track productivity by completed tasks per hour. Revenue per cleaner shows individual impact.
Training engagement and initiative-taking show who’s growing. These numbers spotlight top performers and areas to improve.
How can customer satisfaction scores be effectively utilized to enhance cleaning services?
Shoot for satisfaction ratings above 4.5 out of 5. Collect feedback monthly to spot trends.
Link satisfaction scores to specific tasks or cleaners. This helps you see what needs attention.
Low scores should trigger quick action plans. Teams like seeing how their work affects customer happiness.
Talk to clients about survey results. Satisfaction data helps you make smart service tweaks.
What strategies help in using quality audit outcomes to drive performance improvements?
Do quality audits every month at each location. Document issues and track changes over time.
Teams improve when they get feedback right after audits. Action plans with deadlines fix problems faster.
Tie audit scores to incentives like vouchers or team events. It motivates without just raising pay.
If the same issues keep popping up, focus on training. Trends show if problems are individual or company-wide.
In what ways can revenue per cleaner be increased without compromising the quality of service?
Process tweaks can cut cleaning time by 10% without hurting quality. Better gear and supplies help teams work faster.
Cross-training lets cleaners handle more job types. That flexibility means more services per person.
Optimize schedules to cut travel time. Efficient routes mean more jobs done.
Training helps cleaners learn premium skills. Higher-skilled workers take on better-paying services.
How can high team turnover rates be identified and addressed in the cleaning industry?
When turnover is above average, something’s wrong with satisfaction or conditions. Exit interviews show why people leave.
Poor communication and lack of feedback push people out. Regular check-ins help catch problems early.
Bad or rushed training makes work harder. Solid onboarding helps new hires feel confident.
Recognition programs and clear paths for growth keep people around. Employees stay longer when they see real opportunities.
What methods can managers adopt to boost cleaning team productivity without resorting to micromanagement?
Clear task lists and scope of work documents let teams know what’s expected. Honestly, workers just do better when they aren’t guessing about their tasks.
Performance incentives like movie tickets or restaurant vouchers add motivation, but without that heavy-handed pressure. Even small rewards can lift morale more than you’d expect.
When managers offer regular training, it shows they’re invested in employee development. Teams pick up new techniques and get faster over time.
Monthly team meetings open the door for feedback and real conversation. If there’s a problem, open dialogue can catch it before it drags everyone down.
Goal-setting works best when targets feel possible but still push the team a bit. Usually, 3-7 clear KPIs are enough—anything more just gets confusing.