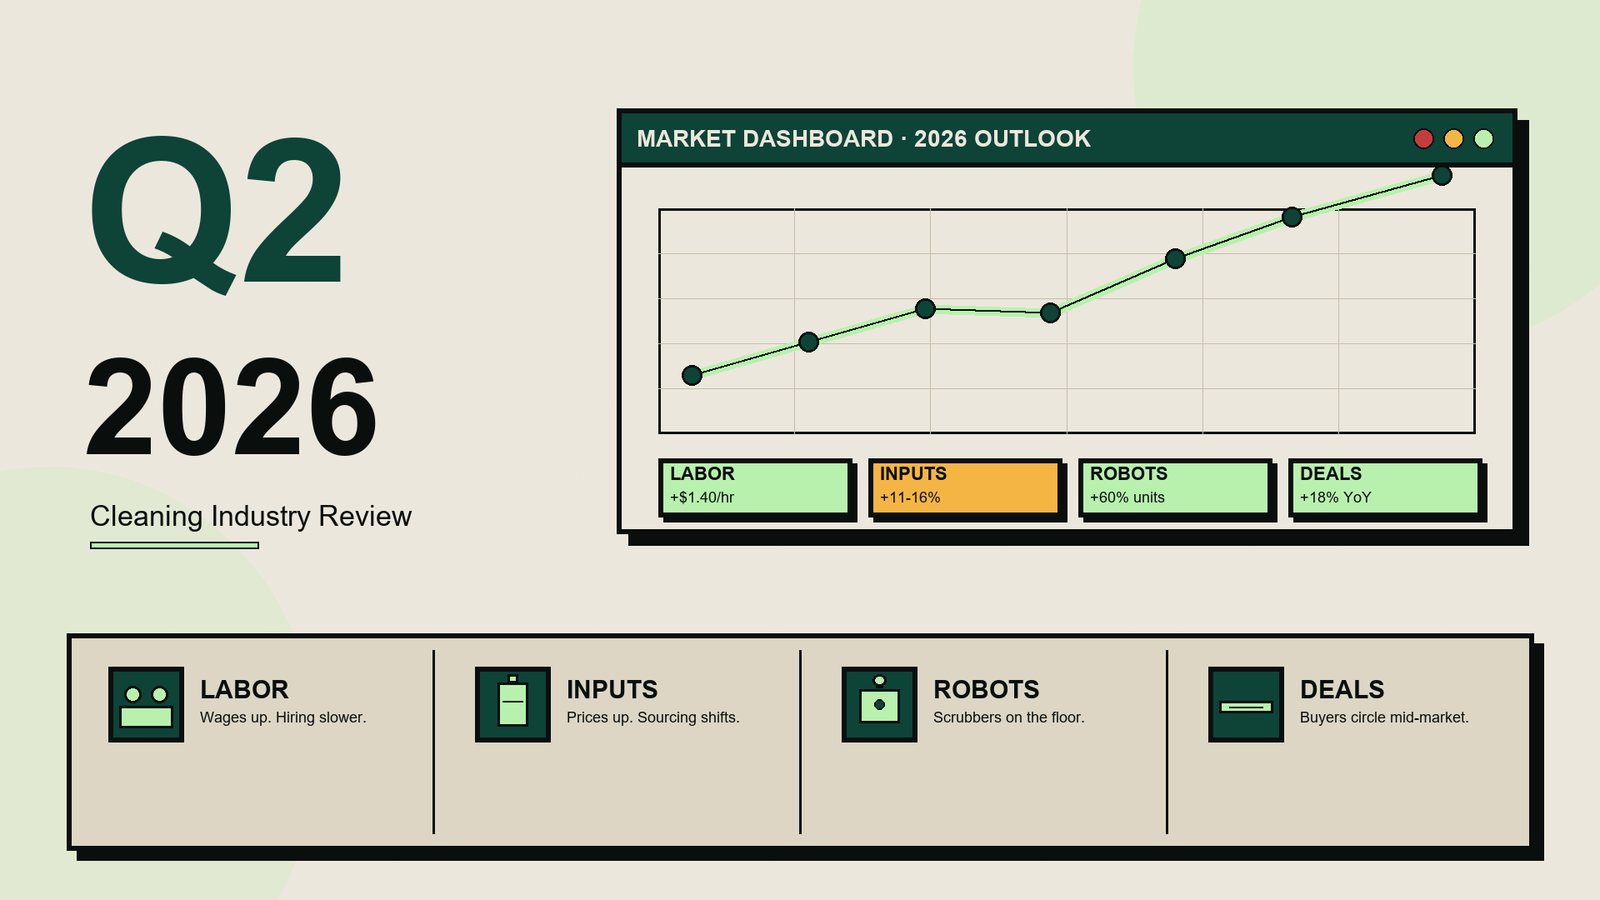
Q2 2026 Cleaning Industry Review: Labor, Costs, Automation, and Demand
A data-led review of the cleaning services industry in Q2 2026: labor markets, supply costs, automation adoption, M&A activity, and demand shifts across commercial and residential segments.
 CE CleanerHQ Editorial
·
April 23, 2026
·
12 MIN READ
CE CleanerHQ Editorial
·
April 23, 2026
·
12 MIN READ
Quick answer
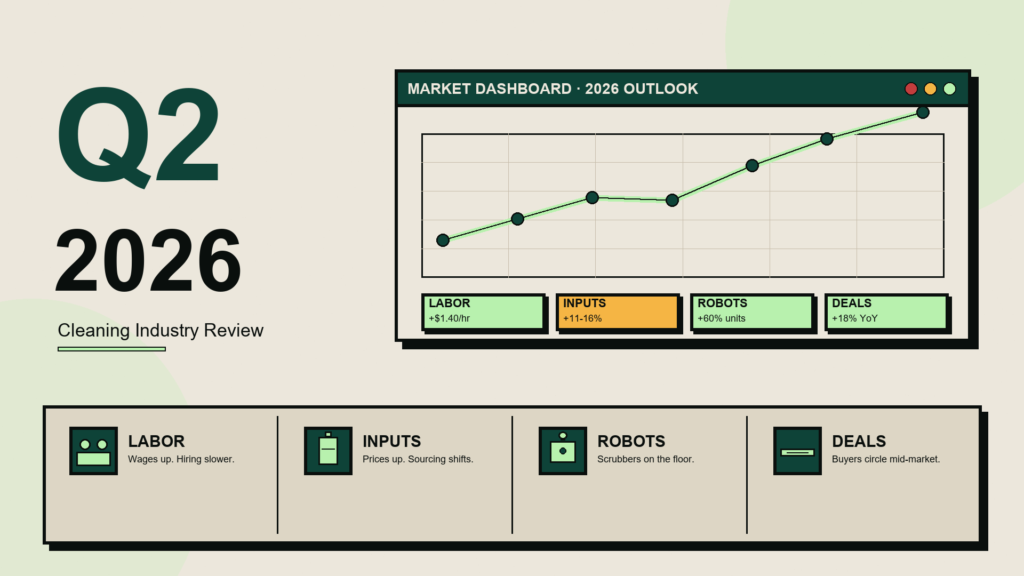
The U.S. cleaning services industry entered Q2 2026 with cost pressure from three sides: tighter labor supply, higher chemical input prices, and state minimum-wage increases that took effect January 1. At the same time, capital is flowing faster than ever — private-equity roll-ups are accelerating and automation economics have crossed a real inflection, with autonomous floor-cleaning operating at roughly $0.41/hr versus $7.56/hr for manual labor.
This review summarizes what changed in the cleaning services industry during the first four months of 2026 and what the available data suggests about the rest of the year. It is written for business owners, facility managers, and analysts who track the sector. Figures are drawn from public sources: trade associations (ISSA, BSCAI), the Bureau of Labor Statistics, federal policy trackers, U.S. Census data, the International Energy Agency, and market research published by Grand View Research, Research Nester, IBISWorld, and Kline Group. Source links appear in the final section.
Key figures at a glance
| Metric | Value | Context |
|---|---|---|
| Global cleaning services market (2026) | $330–480 billion | Varies by analyst methodology; published estimates agree the market crossed $300B in 2025 |
| U.S. janitorial services market | ~$82 billion | Grand View Research 2025 estimate; projected 3.3% CAGR to $105B by 2033 |
| U.S. residential maid services | $17.2 billion | MarketResearch.com 2025; +5.5% 2026 growth forecast |
| Companies reporting staffing difficulty | ~80% | ISSA 2026 industry survey |
| Net U.S. immigration (2026 forecast) | ~321,000 | Down from 2.7M in 2024 — an ~88% two-year decline |
| States raising minimum wage in 2026 | 22 states + 66 cities | NELP, GovDocs |
| Cleaning robot global TAM (2026) | ~$21 billion | Projected 17.5% CAGR to $77B by 2034 |
| Robotic floor cleaning vs manual labor | $0.41/hr vs $7.56/hr | Industry automation benchmarks; typical commercial floor coverage |
| BASF consumer detergent price hike (April) | ~30% | Bloomberg, April 2026 |
| Brent crude, Q2 peak vs April close | ~$120 → ~$92 | IEA Oil Market Report, April 2026 |
1. Labor: the structural story of the quarter
The defining feature of the Q2 2026 cleaning market is a labor supply tightening that has no recent precedent. The Bureau of Labor Statistics classifies “building and grounds cleaning and maintenance” as one of the largest occupational categories in the U.S. economy by employment, with a 2023 median wage near $17 per hour — roughly 32% below the national median of $25.
Two forces have converged on that supply.
Immigration flow
Net immigration into the United States fell from roughly 2.7 million in 2024 to about 1.3 million in 2025. Congressional Budget Office and private-sector demographic forecasts project a further decline to approximately 321,000 in 2026 — an ~88% decline in the net annual flow across two years. Cleaning is one of the most immigrant-dependent occupational categories in the country; the effect is most visible in cleaning applicant pools in Florida, Texas, Arizona, California, New York, and New Jersey.
State minimum-wage increases
Twenty-two states and sixty-six cities raised their statutory wage floors effective January 1, 2026, according to the National Employment Law Project. The changes most directly affecting cleaning employers:
- California: state minimum $16.90; healthcare-sector minimum (including janitorial work in hospital and clinic settings) $18.00
- Connecticut: $16.94 — the second-highest state minimum in the country
- Missouri: $15.00, the first year at that level
- Washington, Oregon, Colorado, New Jersey, Maryland, New York: all above the $15 floor with scheduled mid-year step-ups
By year-end 2026, eleven states and sixty-five localities will be at or above $15 per hour; four states and more than 500 localities will reach or exceed $17.
The combined effect, reported consistently across industry sources including ISSA’s 2026 policy briefing and JaniJobs’ 2026 Cleaning Labor Outlook, is wage-cost inflation in the cleaning wage band of roughly 8% to 12% year-over-year, with approximately 80% of cleaning companies reporting difficulty fully staffing shifts at current wage levels. The relative cost of a marginal cleaning hour is at one of the highest levels in the industry’s post-1970s history, even after adjusting for consumer-price inflation.
2. Operating costs: chemical inputs and supply chain
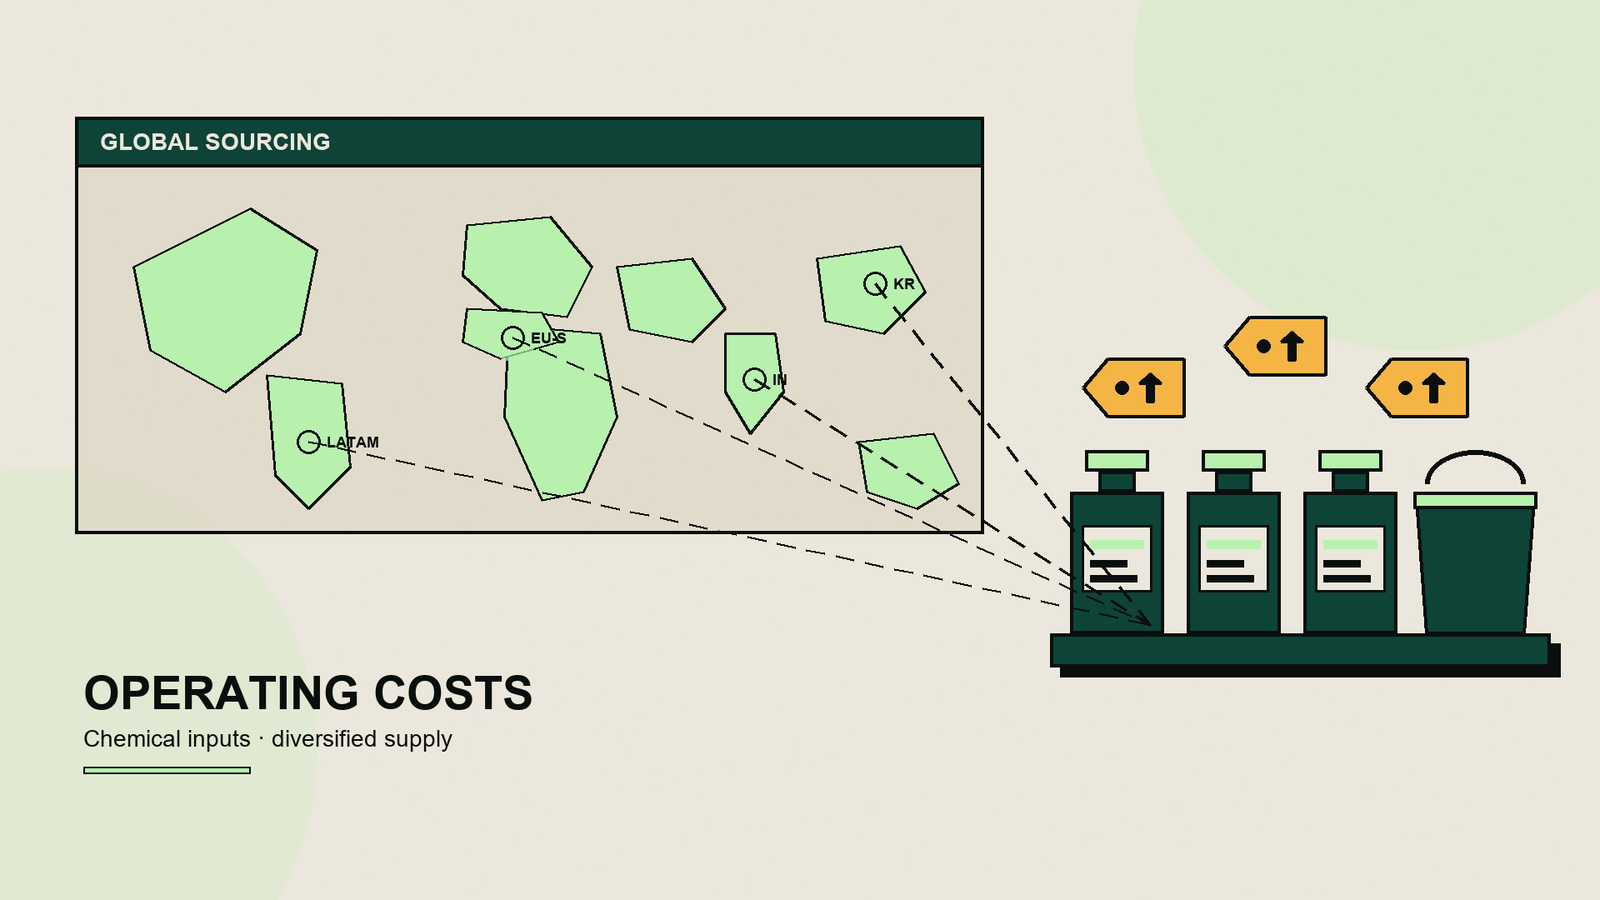
Cleaning-chemical prices rose sharply from mid-February onward, with the full effect still working through distributor channels as of late April. Petrochemical feedstocks — ethylene, propylene, naphtha, aromatics (toluene, xylene, benzene), acetone, and isopropyl alcohol — are the base materials for the surfactants, solvents, bleaches, quaternary ammonium disinfectants, and polymer thickeners that make up the bulk of commercial and institutional cleaning chemistries. Global supply volatility during February and March drove feedstock costs materially higher:
- Polyethylene: variable production costs in Asia approximately doubled between early February and late March (Bloomberg; Chemistry & Engineering News). Spot prices rose 40–50% in the same window.
- Polypropylene: up roughly 9% in Asia in early March (ChemAnalyst).
- Diethylene glycol (DEG): up roughly 17% in Asia and 5% in Europe in early March.
- General Chinese plastics: up roughly 15% on average in buyer surveys.
- Consumer detergents: BASF SE announced an approximately 30% price increase in April, one of the largest single adjustments in consumer chemicals in the past decade (Bloomberg).
Cleaning-chemical buyers have responded by diversifying sourcing toward South Korean, Indian, European, and South American suppliers. According to distributor reports cited by Kline Group, base prices at alternative suppliers are 3–12% higher than pre-volatility sources, but delivery risk is materially lower. The net landed-cost effect on cleaning chemistries in Q2 2026 is approximately 15–25% year-over-year, depending on SKU and purchasing horizon.
The U.S. tariff environment has been a secondary factor. The average effective U.S. tariff rate settled at roughly 13.7% in February 2026 (Tax Foundation). Chemicals were largely exempted via specific carve-outs covering ethylene-based polymers, nylon resins, titanium dioxide pigments, silicones, and pharmaceuticals (C&EN, February 2026). The direct tariff hit to the cleaning-chemical import basket has been smaller than initially feared, though re-routing friction adds approximately 3–8% to landed cost on affected SKUs.
For most operators, the practical result is a sequence of mid-year price-increase notices from chemical distributors, typically ranging from 8% to 18% across product lines, with specialty surfactants and certain disinfectants at the upper end.
3. Automation and technology: a real inflection
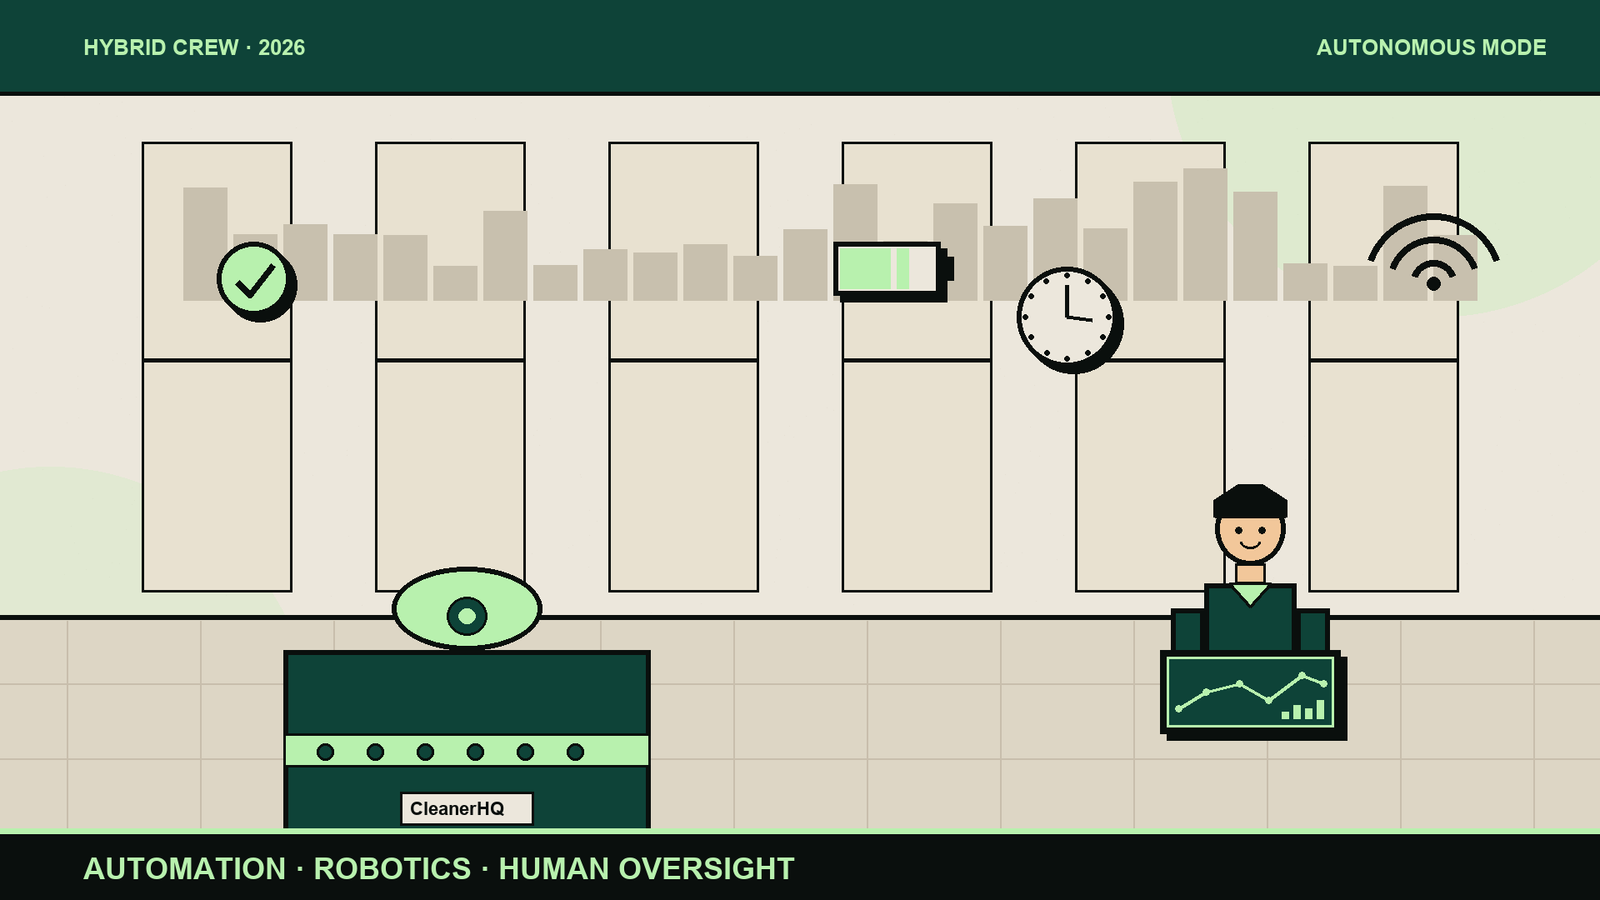
The cleaning robot market crossed $21 billion globally in 2026 and is forecast by multiple market research firms to grow at roughly 17.5% compound annual growth rate through 2034, reaching $76 billion. A year ago, that growth rate was met with skepticism. The Q2 2026 operating-cost picture now makes it look conservative.
The unit economics have shifted sharply. Industry-reported operating costs for autonomous commercial floor-cleaning equipment run approximately $0.41 per hour once depreciation and supervision are included, compared with roughly $7.56 per hour for manual labor performing comparable square-footage coverage (Brain Corp, Avidbots, and benchmarking reports across major operators). Payback periods on robot capital have compressed from 24–36 months in 2023 to 3–9 months in 2026 for facilities running 40–60 hours per week of machine time.
Adoption is strongest in:
- Healthcare — infection-control protocols plus chronic labor shortages
- Airports, transit hubs, and large retail — high square-footage and predictable overnight windows
- Data centers — specialized low-dust, anti-static, temperature-controlled protocols
- Hospitality — Marriott, Hilton, and others piloting in conference and banquet spaces
Published case studies indicate major airports have reached approximately 25% cost savings on robotic floor-cleaning pilots; IoT-enabled buildings integrating occupancy sensors with cleaning dispatch report cleaning-related cost reductions of up to 30%. The main North American vendors scaling in 2026 include Brain Corp (licensor behind Whiz and ICE Cobotics), Avidbots, SoftBank Robotics, and Tennant’s x4 ROVR line. Chinese entrants including Orion Star are competing aggressively on price.
Beyond the machines themselves, software automation has matured. AI-assisted proposal generation, route optimization, dispatch, and multilingual chat for field crews have moved from early-adopter features to standard expectations on commercial contracts. The Bureau of Labor Statistics has not yet reclassified cleaning occupations, but the day-to-day skill profile of the median commercial cleaner in 2026 increasingly includes tablet-based checklists, mobile clock-in with geofencing, and at-shift translation — areas where a manual-labor classification understates the work.
4. M&A and consolidation
U.S. janitorial services remains a fragmented category — roughly $100 billion in aggregate revenue distributed across tens of thousands of small and regional operators. Middle-market advisors tracking the sector reported robust deal activity in Q1 2026, consistent with trends in the back half of 2025.
- Clean Power acquired Advance Janitorial in Q1 2026, a regional consolidation transaction typical of the current cycle (PE Marketplace).
- ABM Industries, the largest U.S. janitorial pure-play at roughly $7.8 billion in revenue, reported 6.2% year-over-year revenue growth in Q3 2025 (most recent public filing), indicating continued appetite for tuck-ins.
- ServiceMaster, Jani-King, Jan-Pro, and Vanguard Cleaning Systems remain the most active franchise networks; regional platforms backed by private equity — including Planned Companies, HES Facilities, Vixxo, and Cascade Building Services — have been particularly active in the South and Pacific Northwest.
Several factors are driving consolidation: client demand for single-vendor management of multi-site portfolios; procurement scale benefits (particularly relevant given chemical input inflation); compliance and technology infrastructure costs that are becoming hard for small operators to carry; and forced sellers — smaller operators under simultaneous margin pressure from labor and chemicals are increasingly choosing to sell rather than re-underwrite their business.
The most generous multiples in 2026 go to operators with multi-year transferable customer contracts, low customer concentration (no single client exceeding 15% of revenue), demonstrated labor-cost pass-through mechanisms in pricing, and a modern technology stack. Single-vertical or single-contract operators face the lowest multiples and in some cases are being rolled up at distressed valuations.
5. Demand: a bifurcating market
Aggregate cleaning demand remains healthy — the U.S. cleaning services market is still projected to grow in 2026 — but the composition of that growth is shifting sharply by segment.
| Segment | 2026 direction | Driver |
|---|---|---|
| Residential maid / house cleaning | +5.5% (2026 forecast) on $17.2B 2025 base | Dual-income households (~70% of demand); recession-resilient at premium tier |
| Commercial office cleaning | Flat to –3% | Office vacancies still a drag; contracts renegotiated lower |
| Healthcare cleaning | +6 to +8% | Permanent infection-control protocols; IAQ mandates spreading |
| Industrial / specialty cleaning | +8 to +12% | Biotech, data centers, EV plants, semiconductor fabs driving demand |
| Post-construction cleaning | Mixed | Strong where infrastructure and industrial construction active |
| Short-term rental turnover | –5 to –8% | STR demand soft in most metros |
| Biohazard / crime-scene | Stable +3 to +5% | $80–250/hr wage bands intact |
Operators most concentrated in budget residential cleaning and generic commercial office work are the most exposed to the current cost environment. Operators concentrated in healthcare, industrial, and specialty cleaning are seeing demand exceed their capacity to staff.
6. Regulatory and policy environment
Beyond the minimum-wage increases summarized above, several policy areas are drawing industry attention.
- ISSA 2026 policy priorities. The industry’s largest trade association named workforce development, sustainability, and innovation as its three policy priorities for the year. Concrete initiatives include expanded support for registered apprenticeship programs, accelerated adoption of EPA Safer Choice and Green Seal certified chemistries in public-sector procurement, and updated ventilation and indoor-air-quality (IAQ) standards coordinated with ASHRAE.
- Worker classification. Several state attorneys general have opened or expanded investigations into the classification of cleaning workers as independent contractors rather than employees — particularly active in California (AB 5 case law) and New Jersey. Operators using franchise-unit or 1099 models in these states are reassessing exposure.
- Green-cleaning procurement. Federal and state procurement rules increasingly require Green Seal or EPA Safer Choice certification for cleaning chemicals used in government facilities. A growing number of private Fortune 500 facility contracts have adopted similar standards, consistent with corporate ESG reporting frameworks.
- Indoor air quality. Following updates to ASHRAE 62.1 and CDC guidance, several large school districts and healthcare networks have updated cleaning specifications to include HEPA vacuum requirements and documented ventilation coordination. These specifications add modest cost but typically come with longer contract terms.
7. Outlook: the rest of 2026
Based on the data available at the end of Q2, the most likely scenario for the balance of 2026:
- Input-cost pressure persists through at least Q3. Supply-chain dislocation from February and March is expected to work through global chemical markets over the next several quarters. Most distributors are already signaling a second round of price increases for late Q2 or early Q3.
- Labor supply does not rebound. Immigration flow is not projected to recover in 2026. Wage-cost inflation in the cleaning band is expected to continue at 6–10% annualized.
- Automation adoption accelerates. With payback periods under 12 months in many facility types, capital investment in robotic equipment is likely to increase rather than moderate. Adoption moves from early-majority (healthcare, airports, large retail) into mainstream commercial office and hospitality.
- Consolidation continues. Interest rates remain supportive of M&A. Pressure on smaller operators is more likely to intensify than ease. Expect continued PE-backed regional roll-ups and strategic tuck-ins by the largest pure-plays.
- Demand bifurcation deepens. Healthcare, data center, biotech, and EV plant cleaning continue to grow faster than the industry average. Budget residential and generic commercial office continue to lag.
The operators best positioned for the remainder of 2026 share several characteristics: multi-year contracts with input-cost escalation clauses tied to BLS indices; diversified chemical sourcing across at least two geographies; a staff retention strategy that goes beyond wage increases; at least one pilot of autonomous cleaning equipment on a large account; and a customer mix weighted toward growing segments rather than stagnant ones.
8. Methodology and sources
This review synthesizes public data from industry, government, and market-research sources. Figures are current as of April 23, 2026. The review is intended as an editorial summary and does not constitute investment or legal advice.
Industry associations and trade publications
- ISSA — The Worldwide Cleaning Industry Association: 2026 industry news and policy priorities
- BSCAI — Building Service Contractors Association International: M&A briefings
- JaniJobs — 2026 Cleaning Labor Outlook
- CleanLink — monthly industry news archives
- Cleaning and Maintenance Management (CMM)
- Kline Group — Professional Cleaning Chemicals 2026 trends
Market research
- Grand View Research — U.S. Janitorial Services Market, 2025 update
- Research Nester — Global Cleaning Services Market 2035 forecast
- IBISWorld — Petrochemical Manufacturing Industry Report
- Intel Market Research — North America Deep House Cleaning 2026–2034
- MarketResearch.com — U.S. Residential Maid Services
Government and federal
- U.S. Bureau of Labor Statistics — Occupational Employment and Wage Statistics
- U.S. Census Bureau — population and immigration-flow estimates
- Congressional Budget Office — immigration projections
- International Energy Agency — Oil Market Report, March and April 2026
- Federal Reserve Economic Data (FRED) — Producer Price Index, Petrochemical Manufacturing
- Tax Foundation — Tariff tracker
- National Employment Law Project (NELP) — 2026 state minimum-wage summary
- GovDocs — 2026 minimum-wage schedule
Corporate and chemical industry
- Chemistry & Engineering News (C&EN) — chemical industry coverage, February and April 2026
- ChemAnalyst — petrochemical price and supply reporting
- Bloomberg — European chemicals coverage and BASF price announcement, April 2026
- ABM Industries — Q3 2025 earnings release
Automation and robotics
- Brain Corp, Avidbots, Tennant, SoftBank Robotics, Orion Star — published product specifications and benchmarking studies
About this review
Quarterly editorial coverage of the cleaning services industry. Published independently by the CleanerHQ editorial desk.
Republication is permitted with attribution and a link back to the original publication. A PDF edition is available on request. The H2 2026 edition will be published on July 23, 2026.
Editorial contact: editorial@cleanerhq.com
Stop estimating from gut feel. Start estimating from your last 90 days.
 CE
CE